
Oakfield School: Integrated Building Performance, HVAC & Low-Carbon Design
A four-storey Birmingham school modelled in IES VE to investigate passive design, daylight-responsive lighting, ApacheHVAC system performance, thermal comfort, indoor air quality and annual operational energy.
1. Executive Summary
Oakfield School is a four-storey educational building in Birmingham modelled in IES Virtual Environment 2026 using an integrated workflow covering building geometry, passive environmental design, SunCast solar analysis, RadianceIES daylight assessment, detailed ApacheHVAC system design and annual dynamic simulation.
The final model contains 6,061.8 m² of floor area, 6,034.3 m² of conditioned floor area, approximately 28,234.5 m³ of conditioned volume and 83 conditioned rooms. Eighteen ApacheHVAC systems serve teaching, laboratory, administration, dining, sports, kitchen, WC, library, gallery, atrium, specialist and plant-related zones.
The building uses an electrified low-carbon plant strategy comprising a 335.23 kW air-to-water heat pump with 50.28 kW electric backup heating and a 232.63 kW air-cooled chilled-water system. Final HVAC sizing gives a coincident plant/equipment load of 268.18 kW for heating and 202.29 kW for cooling.
Performance indicator | Final result | Design interpretation |
Annual heating-coil thermal energy | 423.34 MWh/yr | Heating is the dominant thermal service |
Annual cooling-coil thermal energy | 22.47 MWh/yr | Cooling is seasonal and much smaller than heating |
Annual heating-coil peak | 453.08 kW | Short-duration winter morning recovery |
Annual hot-water-loop peak | 451.91 kW | Morning warm-up drives the central heating peak |
Annual cooling-coil peak | 221.73 kW | 95.3% of 232.63 kW nominal cooling capacity |
Site energy intensity | 54 kWh/m²·yr | Whole-building annual site energy |
Operational carbon | ~7 kgCO₂/m²·yr | Annual operational carbon result |
Peak electrical demand | 247.9 kW | 17 February morning heating event |
Occupied mean CO₂ | ~725 ppm | Across 18 teaching/learning spaces |
Mean occupied PMV | ~-0.21 | Slight cool bias during occupied periods |
Overall finding The school is heating dominated. The strongest improvement opportunity is to reduce the intensity of winter morning recovery while ensuring ventilation reaches occupied flow before teaching begins. This improves peak electrical demand, thermal comfort and indoor air quality without relying on larger plant. |
2. Project Brief and Design Intent
The project was developed as a low-energy, climate-responsive school for Birmingham. The accommodation includes classrooms, group-learning spaces, project studios, laboratories, administration, dining, sports, kitchen, library, specialist teaching areas and shared circulation.
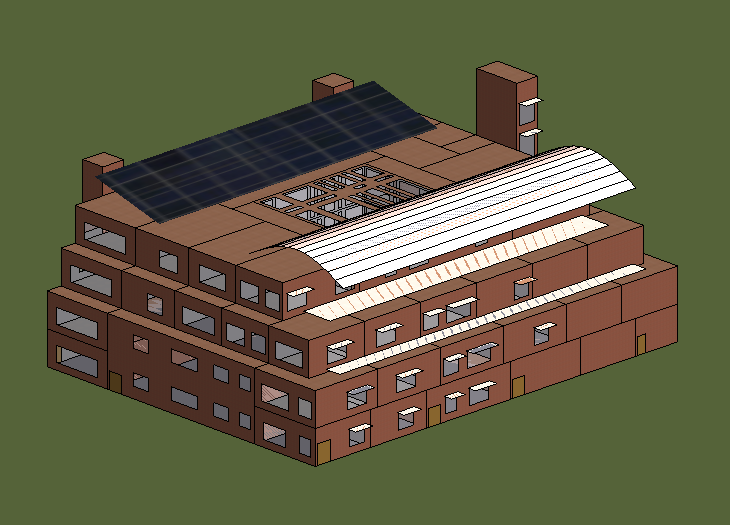
Passive and environmental features incorporated into the design include a central climate atrium, solar chimney, east and west wind towers and roof-level environmental elements. These features were coordinated with solar exposure, daylight, ventilation and HVAC design so that the architectural concept and building-services strategy were assessed as one system.
The design objective is to minimise avoidable heating, cooling, lighting and fan energy while maintaining stable occupied thermal conditions and adequate ventilation in high-density teaching spaces.
3. Building Model and Zoning
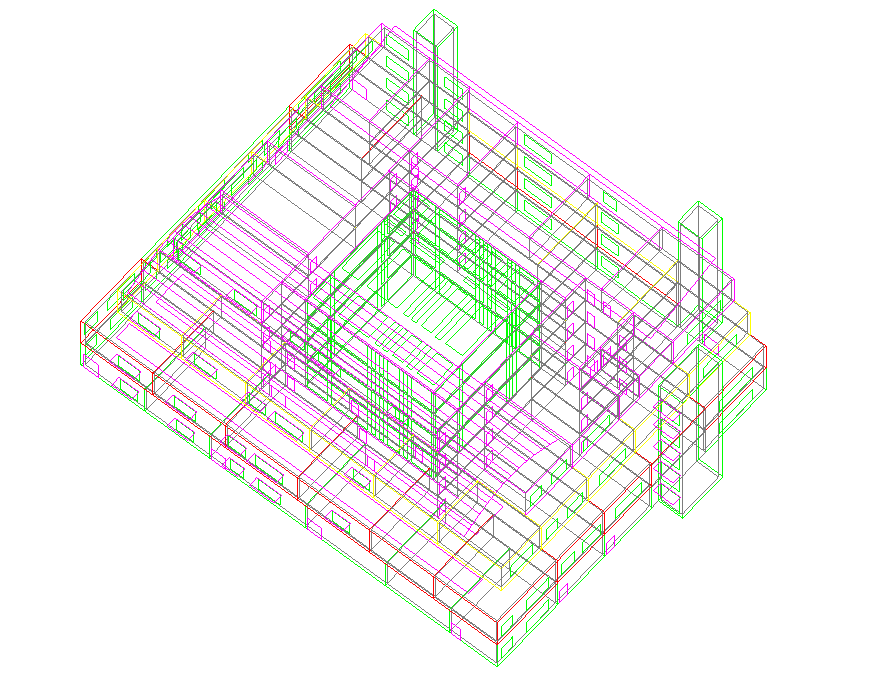
Figure 1. IES VE axonometric model of the four-storey Oakfield School building.
Model parameter | Final value |
Model floor area | 6,061.8 m² |
Conditioned floor area | 6,034.3 m² |
Conditioned volume | 28,234.5 m³ |
Conditioned rooms | 83 |
Orientation | 0° |
Location | Birmingham, United Kingdom |
Thermal zoning follows actual space use rather than a single generic school template. Teaching rooms, laboratories, administration, catering, library areas, circulation, galleries, specialist spaces and plant rooms are separated where occupancy density, internal gains, ventilation requirement or control strategy differs. This zoning approach is fundamental to the HVAC results because room occupancy, equipment and outdoor-air demand determine terminal airflow, coil duty and system-level plant demand.
4. Fabric, Solar and Daylight Strategy
The envelope and glazing were defined for both thermal and optical performance. The external wall has a modelled U-value of 0.2599 W/m²K. The window system has a net U-value of 1.60 W/m²K, glass g-value of 0.3993 and visible light transmittance of 0.71.
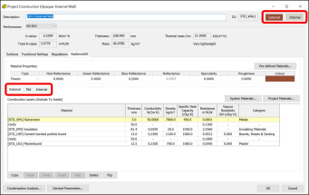 | 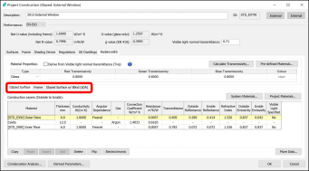 |
Figure 2. Thermal and optical construction inputs used for the external wall and glazed façade.
SunCast was used to represent the effect of building form and external shading on solar exposure before the annual thermal simulation. This is particularly important for teaching spaces, the atrium and glazed areas where solar gains influence cooling demand, perimeter conditions and daylight availability.
RadianceIES was used to assess representative daylight illuminance and to inform daylight-responsive lighting control. The retained annual sensor results show a clear difference between well-exposed and lower-performing spaces, supporting a control strategy in which electric lighting is reduced where useful daylight reaches the workplane.
Representative space | Annual mean illuminance | Peak illuminance |
L0N01 Classroom 01 | 106.2 lux | 1,442 lux |
L0N02 Group Learning 01 | 105.1 lux | 1,408 lux |
L0N04 Classroom 02 | 22.7 lux | 485 lux |
L1N01 Classroom 07 | 102.9 lux | 1,416 lux |
L1N02 Group Learning 03 | 100.9 lux | 1,297 lux |
L1N04 Classroom 08 | 12.0 lux | 228 lux |
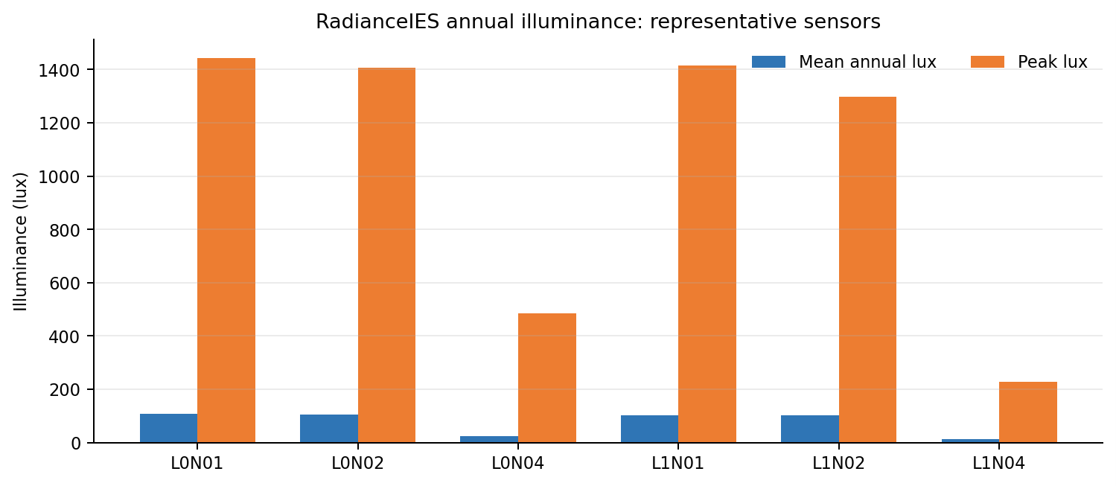
Figure 3. Representative annual RadianceIES mean and peak illuminance results.
Interior lighting energy remains 11.6 kWh/m²·yr, making daylight-responsive lighting a material part of the low-energy strategy. Reducing electric lighting also reduces internal sensible heat gains and therefore supports summer cooling performance.
5. Climate and Design Conditions
HVAC sizing uses Birmingham design weather with the ASHRAE Heat Balance Method. The cooling calculation uses a 0.4% design percentile and the heating calculation uses a 99.6% design percentile.
Design parameter | Value |
Maximum cooling dry-bulb temperature | 29.8°C |
Maximum cooling wet-bulb temperature | 18.8°C |
Winter design temperature | -4.2°C |
Ambient CO₂ concentration | 400 ppm |
These design conditions define nominal equipment duties, while the annual simulation captures changing weather, occupancy and control behaviour throughout the year. The combination of both analyses is used to assess plant sizing and real operating response.
6. HVAC and Ventilation Design
Detailed system modelling was undertaken in ApacheHVAC. Eighteen airside systems serve the building according to function, allowing ventilation and sensible conditioning to respond to the different occupancy and load patterns of teaching, laboratory, administration, catering, library, sports, atrium and specialist spaces.
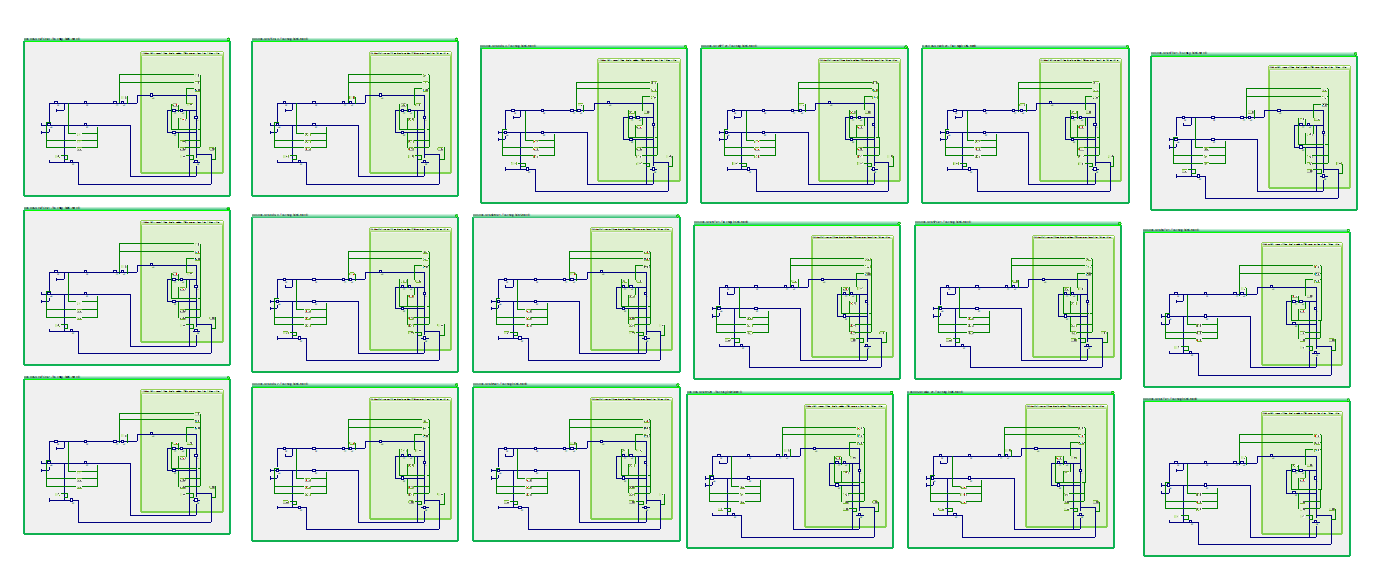
Figure 4. Representative ApacheHVAC airside and waterside network configuration.
System group | Principal spaces served |
AHU-TCH-L0 / L1 / L2 / L3 | Teaching spaces by floor |
AHU-LAB-L0 / L2 / L3 | Laboratory and specialist laboratory spaces |
AHU-ADM-01 | Administration |
AHU-DIN-01 | Dining |
AHU-SPT-01 | Sports |
AHU-KIT-01 | Kitchen |
AHU-WC-01 | WC accommodation |
AHU-LIB-01 | Library areas |
AHU-SPC-01 | Specialist spaces |
AHU-GAL-01 | Galleries and circulation |
AHU-ATR-01 | Central atrium |
AHU-BAT-01 / AHU-ICT-01 | Energy-related and ICT plant spaces |
The airside strategy combines dedicated outdoor-air/mechanical ventilation with heat recovery and local sensible conditioning. Outdoor-air requirements vary by occupancy and room use; teaching spaces commonly operate at approximately 7-8 L/s per person. Classroom 11 requires approximately 129 L/s minimum outdoor air, while Classroom 13 requires approximately 246 L/s.
Ventilation is demand responsive, so actual airflow varies with occupancy and controls rather than remaining at full design flow throughout the day. This reduces fan and ventilation-conditioning energy while retaining the capability to meet high-density occupied demand.
7. Heating and Cooling Plant
The central plant is fully electrified for space conditioning. Heating is provided by an air-to-water heat pump with electric backup, while cooling is provided by an air-cooled chilled-water system.
Plant item | Capacity / flow | Pump power |
Air-cooled chilled-water system | 232.63 kW; 11.12 L/s primary; 11.11 L/s secondary | 0.776 kW primary; 3.101 kW secondary |
Air-to-water heat pump | 335.23 kW; 8.02 L/s primary | 2.414 kW primary |
Electric backup heating | 50.28 kW | - |
Combined nominal heat-source capacity | 385.51 kW | - |
The plant arrangement supports a low-carbon strategy by using heat-pump heating as the primary source and electric backup for peak support. The annual results show that control of winter recovery is more important to performance than simply increasing installed heat-source capacity.
8. HVAC Sizing Results
Final HVAC sizing produced a coincident plant/equipment cooling load of 202.29 kW and a coincident plant/equipment heating load of 268.18 kW.
Load | Coincident space load | Coincident plant/equipment load |
Cooling | 187.79 kW | 202.29 kW |
Heating | 34.05 kW | 268.18 kW |
The large increase from 34.05 kW coincident room heating to 268.18 kW plant/equipment heating shows the importance of winter ventilation-air conditioning. In a densely occupied school, plant duty is driven by both room heat loss and the need to condition outdoor air.
Cooling sizing is much closer to the room-side demand, with 202.29 kW plant/equipment load against 187.79 kW coincident space cooling.
9. Annual HVAC Performance
The annual simulation provides the operating profile that cannot be seen from design-day sizing alone. Heating remains the dominant thermal service, with cooling concentrated mainly between late spring and September.
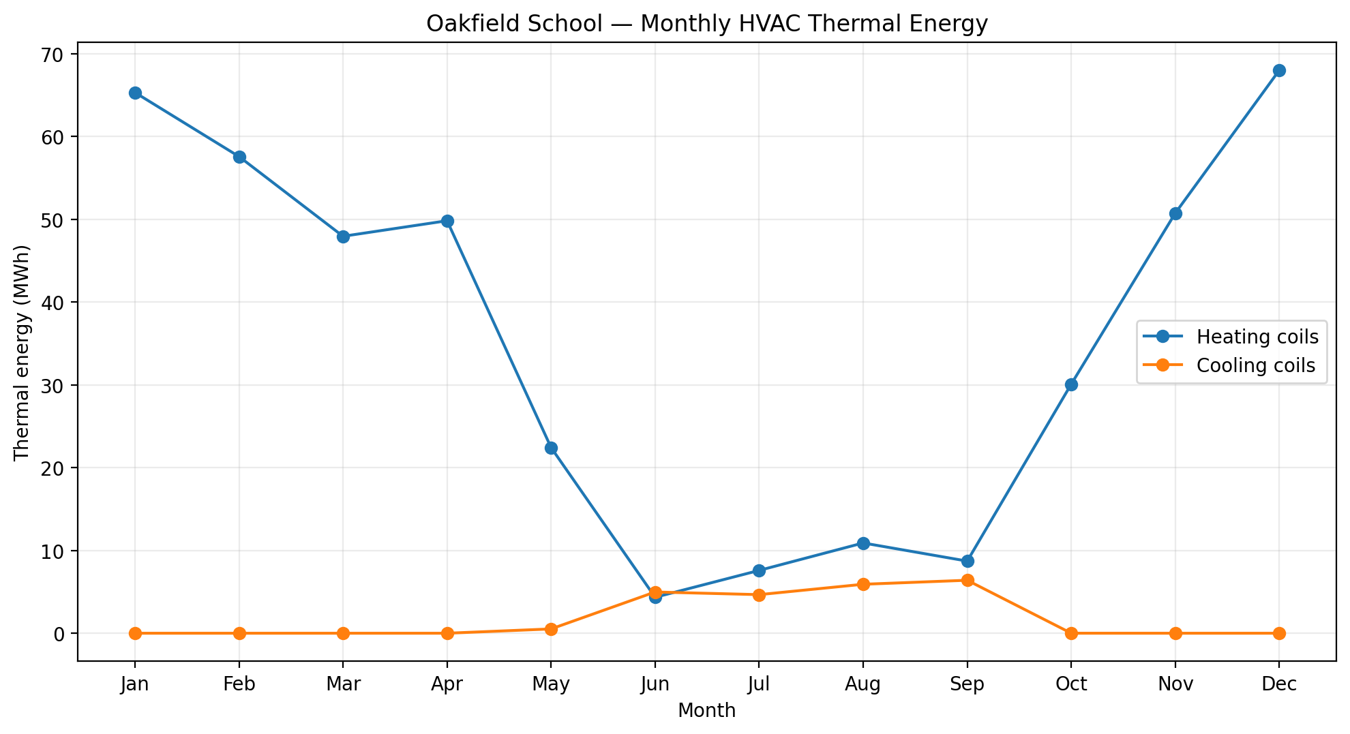
Figure 5. Monthly HVAC thermal energy. Heating dominates annual demand; cooling is concentrated from late spring to early autumn.
9.1 Annual heating performance
Annual delivered heating-coil thermal energy is approximately 423.34 MWh/yr. The corresponding hot-water-loop energy is approximately 422.65 MWh/yr, showing close agreement between coil demand and central loop delivery.
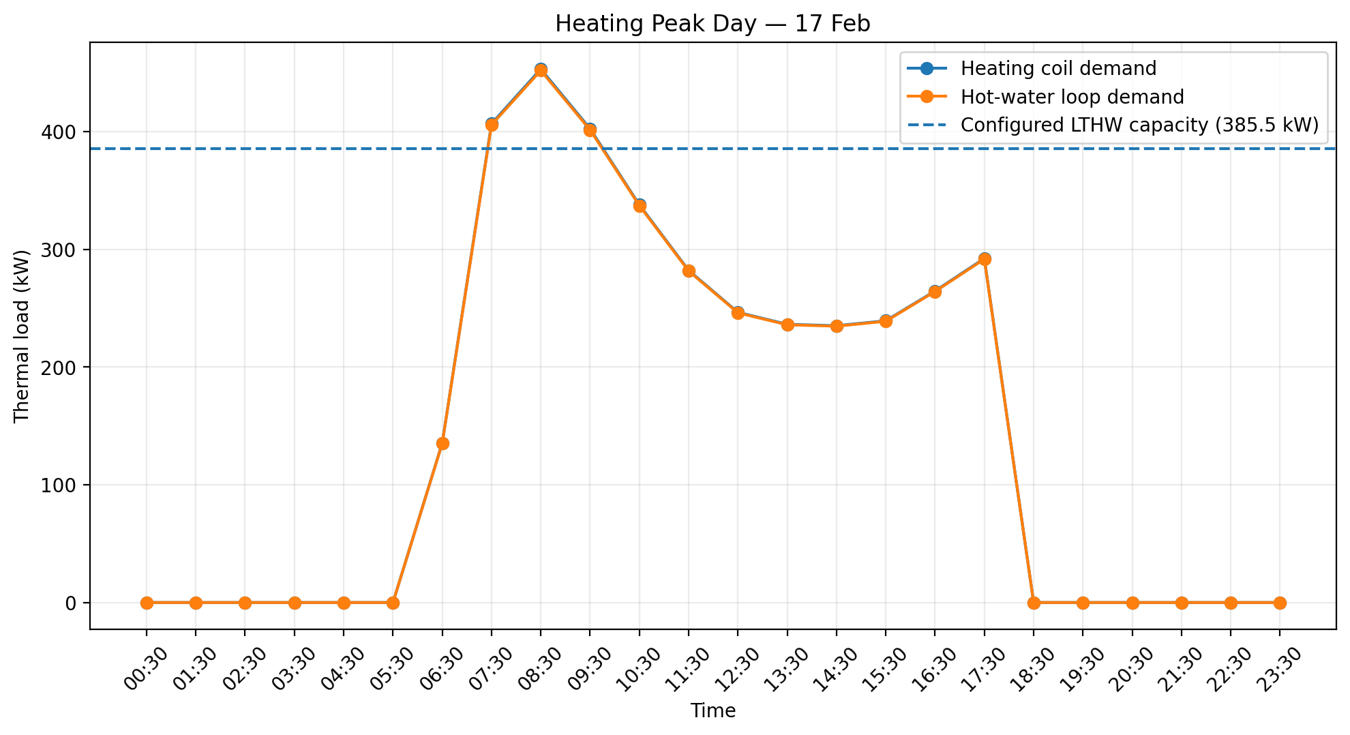
Figure 6. Winter peak-day heating demand on 17 February. The dashed line represents 385.51 kW combined nominal heat-source capacity.
The highest heating-coil demand occurs on 17 February at approximately 08:30 and reaches 453.08 kW. The hot-water-loop peak is approximately 451.91 kW. The profile rises sharply during morning warm-up, then falls as rooms and building fabric recover toward occupied conditions.
The annual warm-up peak is approximately 66.4 kW above the 385.51 kW combined nominal heat-source capacity. The efficient design response is to flatten this short-duration event through earlier staged preheat, optimum-start control, appropriate night setback and explicit backup-heater sequencing.
9.2 Annual cooling performance
Annual cooling-coil thermal energy is approximately 22.47 MWh/yr. The maximum cooling-coil demand is 221.73 kW on 5 September at approximately 16:30.
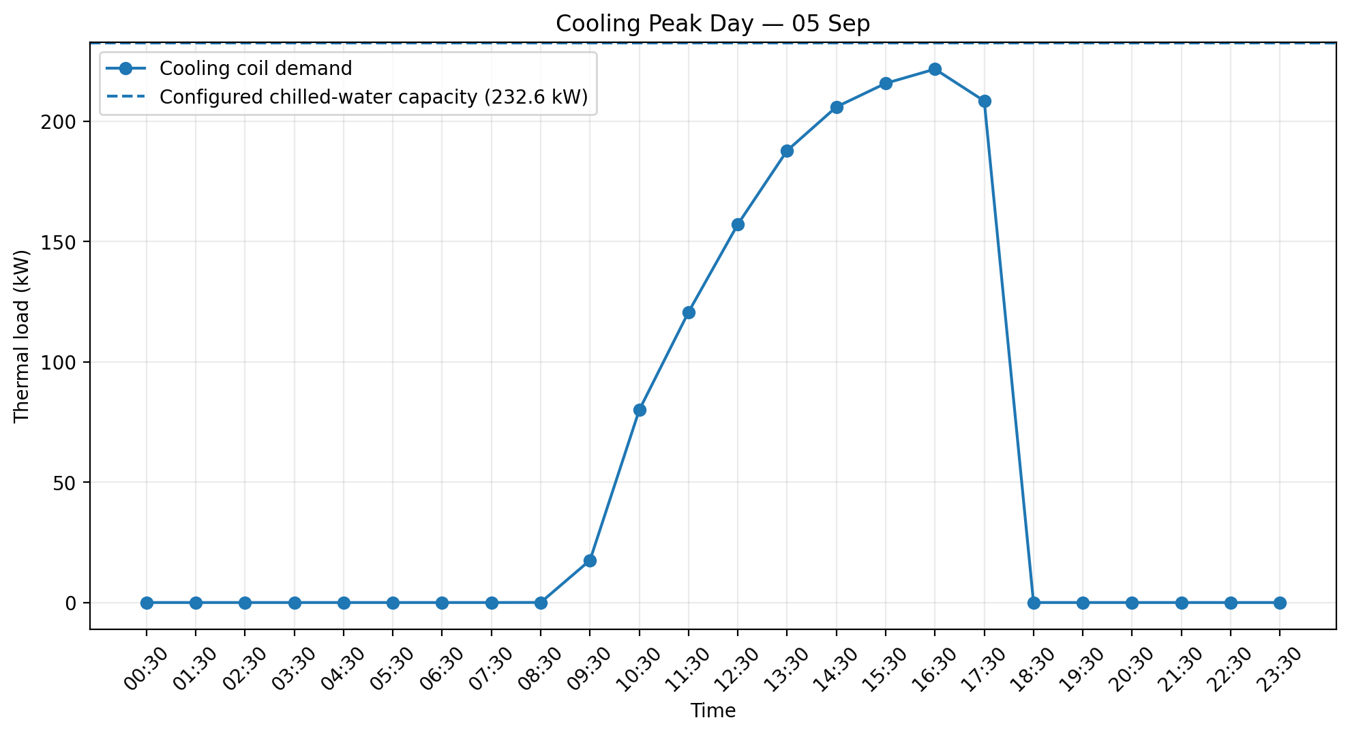
Figure 7. Cooling peak day on 5 September compared with 232.63 kW nominal chilled-water capacity.
At the annual cooling peak, the chilled-water plant operates at approximately 95.3% of nominal capacity, leaving about 10.9 kW or 4.7% headroom. The selected capacity therefore covers the annual simulated peak, while the small margin places emphasis on accurate flow, water-temperature and coil-control commissioning.
10. Thermal Comfort and Indoor Conditions
Occupied thermal conditions were assessed using air temperature, operative temperature and PMV. The results show a generally stable occupied environment with a slight cool bias, concentrated mainly in the winter morning transition from setback to normal operation.
Occupied-period indicator | Result |
Mean air temperature | ~20.0°C |
5th percentile air temperature | ~16.5°C |
95th percentile air temperature | ~23.5°C |
Mean operative temperature | ~19.9°C |
5th percentile operative temperature | ~16.4°C |
95th percentile operative temperature | ~23.6°C |
Mean PMV | ~-0.21 |
Observations within PMV ±0.5 | ~71% |
Observations within PMV ±1.0 | ~94% |
The result directs comfort improvement toward start-up control rather than a blanket increase in occupied heating setpoint. Earlier and better staged recovery can reduce the cool tail while avoiding higher all-day heating demand.
Relative humidity follows the expected seasonal response, with lower indoor RH during cold periods as outdoor air is heated and higher values during warmer conditions. Temperature, ventilation and RH are therefore considered together when tuning occupied conditions.
11. Indoor Air Quality and Ventilation Performance
Occupied CO₂ was analysed together with ApacheHVAC airflow. Across 18 teaching and learning spaces, the pooled occupied mean is approximately 725 ppm and the 95th percentile is approximately 1,104 ppm. The distribution is generally moderate, with a small number of short-duration high-CO₂ events requiring control attention.
Occupied CO₂ indicator | Result |
Mean | ~725 ppm |
95th percentile | ~1,104 ppm |
Observations >1,000 ppm | ~27.0% |
Observations >1,500 ppm | ~0.48% |
Observations >2,000 ppm | ~0.14% |
Maximum observed | 3,223 ppm |
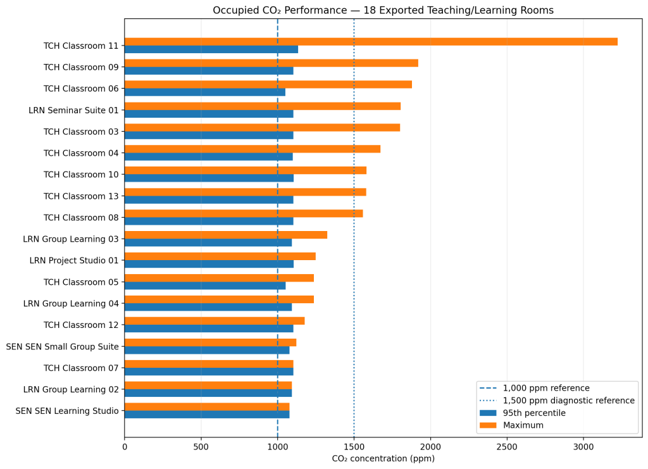
Figure 8. Occupied CO₂ performance across 18 teaching and learning spaces.
Classroom 11 is the clearest control case. The room requires approximately 129 L/s minimum outdoor air. During the analysed morning event, occupancy starts before full ventilation delivery, allowing CO₂ to rise rapidly.
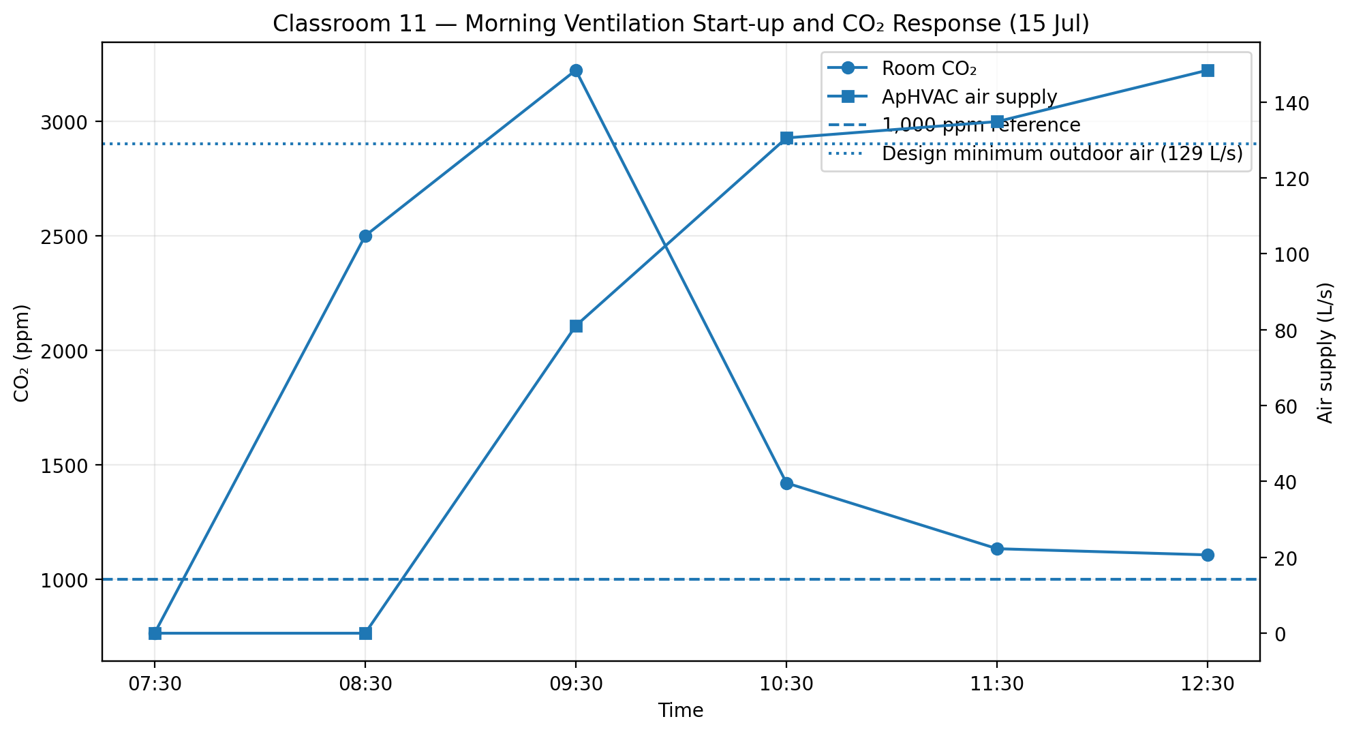
Figure 9. Classroom 11 morning ventilation start-up and CO₂ response on 15 July.
CO₂ reaches approximately 3,223 ppm while air supply is still ramping. As airflow approaches and then exceeds the room design minimum, concentration falls rapidly toward approximately 1,400 ppm and then close to 1,100 ppm. The required improvement is to establish occupied minimum airflow before teaching begins, while retaining demand-controlled operation after start-up.
12. Operational Energy and Electrical Demand
The final annual simulation gives approximately 54 kWh/m²·yr site energy and approximately 7 kgCO₂/m²·yr operational carbon. Heating electricity is the largest end use, followed by process energy, interior lighting and fans.
End use | Site energy intensity |
Heating electricity | 20.9 kWh/m²·yr |
Process | 12.0 kWh/m²·yr |
Interior lighting | 11.6 kWh/m²·yr |
Interior fans | 7.0 kWh/m²·yr |
Data centre | 1.5 kWh/m²·yr |
Space cooling | 0.8 kWh/m²·yr |
Receptacles | 0.5 kWh/m²·yr |
Pumps | 0.2 kWh/m²·yr |
Whole-building site EUI | 54 kWh/m²·yr |
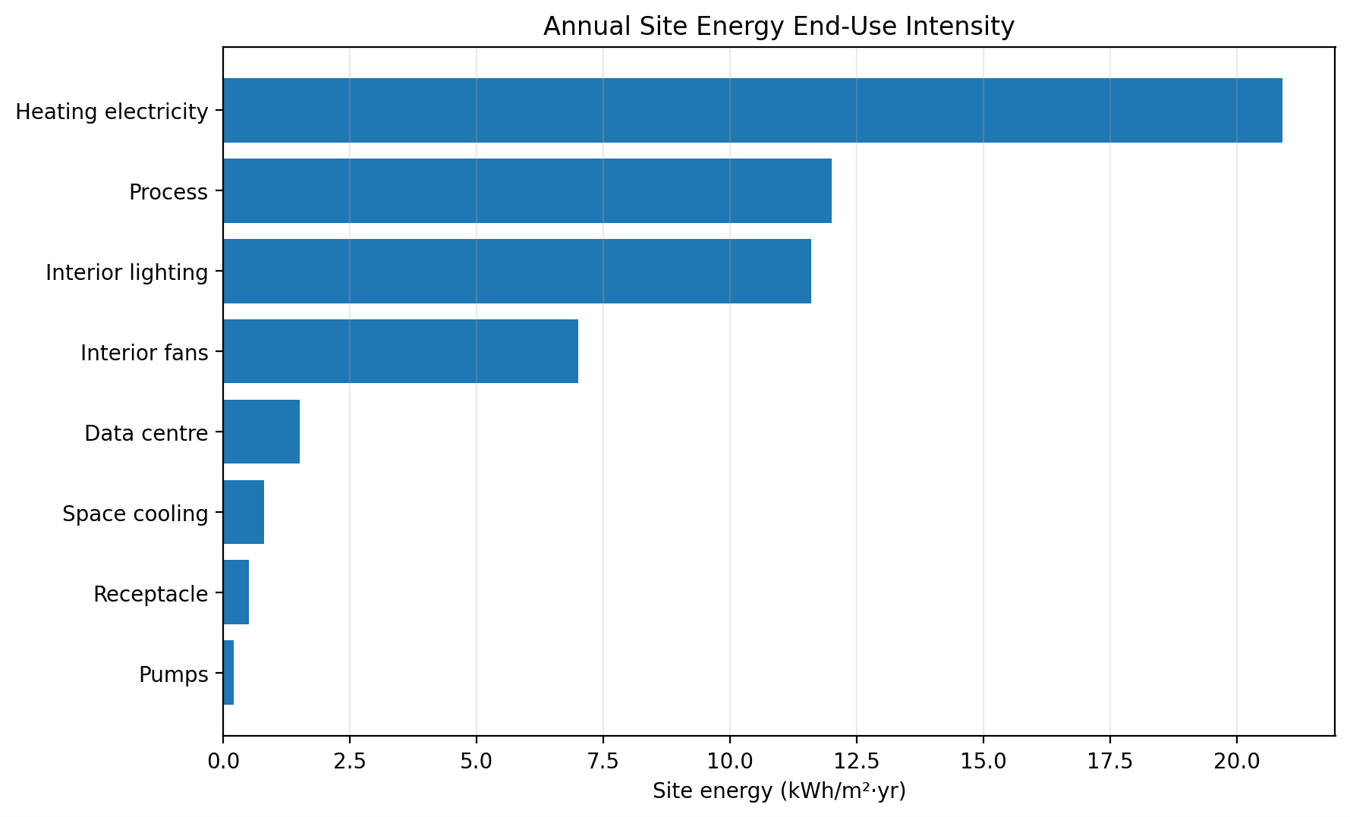
Figure 10. Annual site-energy end-use intensity.
Heating electricity accounts for approximately 39% of reported site EUI. Fan energy is also material at 7.0 kWh/m²·yr and is substantially greater than cooling electricity at 0.8 kWh/m²·yr. The low-carbon design priority is therefore to reduce heating and ventilation energy first, while maintaining the existing low cooling contribution.
Peak electrical demand is 247.9 kW on 17 February at approximately 07:00. This coincides with the annual heating-peak day and confirms that winter morning recovery is the key electrical peak-demand event.
13. Integrated Performance Assessment
The final simulation presents a consistent performance picture across thermal loads, indoor conditions, ventilation and energy use:
· The school is strongly heating dominated: annual heating-coil delivery is approximately 423.34 MWh compared with 22.47 MWh cooling-coil delivery.
· Winter heating plant demand is driven by both outdoor-air conditioning and morning recovery, not only by envelope transmission.
· The cooling system meets the annual simulated peak but operates close to nominal capacity during the highest event.
· Occupied comfort has a slight cool bias, concentrated at the winter start-up transition rather than across the full occupied day.
· Demand-responsive ventilation is energy efficient, but air delivery must be established before occupancy to prevent short-duration CO₂ spikes.
· Heating electricity, lighting, process loads and fan energy dominate annual site consumption; cooling electricity remains comparatively small.
· Passive solar control and daylight-responsive lighting directly support both energy reduction and reduced cooling gains.
Design direction The next performance gain should come from coordinated passive-load reduction and control optimisation: reduce solar and lighting gains where appropriate, recover winter heat efficiently, lower fan pressure demand, start heating and ventilation earlier but more gradually, and tune occupied conditions by zone rather than increasing plant size or setpoints globally. |
14. Design Improvement Strategy
The most efficient path to better passive performance, lower operational carbon and improved indoor conditions is a staged design strategy that addresses load reduction first, then controls, then commissioning. The priorities below follow directly from the modelled performance.
Priority | Design action | Performance objective |
1. Reduce passive loads | Refine external shading and solar control using SunCast results; prioritise façades and spaces contributing to the late-summer cooling peak. Maintain glazing solar-control performance while protecting useful daylight. | Reduce solar gains, perimeter heat stress and cooling-coil demand without increasing mechanical energy. |
2. Use daylight as an energy measure | Retain and commission daylight-responsive dimming. Improve sensor zoning and lighting control so electric lighting falls when useful daylight is available. | Reduce the 11.6 kWh/m²·yr lighting load and associated internal heat gains. |
3. Coordinate passive ventilation features | Use the climate atrium, solar chimney and wind-tower concept as controlled purge and stack-ventilation routes during suitable outdoor conditions, coordinated with mechanical ventilation. | Reduce avoidable fan operation and support summertime heat removal while maintaining controlled occupied ventilation. |
4. Flatten winter morning recovery | Apply optimum start, earlier staged preheat and a shallower or more responsive night setback. Sequence the 50.28 kW electric backup only when required. | Reduce the 451.91 kW LTHW transient and the 247.9 kW electrical peak while improving early-morning comfort. |
5. Establish ventilation before occupancy | Pre-start teaching AHUs so room minimum outdoor air is available at the beginning of occupancy, then return to demand-controlled airflow. | Prevent Classroom 11-type CO₂ spikes without operating maximum ventilation continuously. |
6. Minimise ventilation auxiliary energy | Reduce pressure losses through ductwork, filters, heat-recovery sections and terminals; maintain efficient heat recovery and demand control. | Lower the 7.0 kWh/m²·yr fan-energy contribution and reduce winter ventilation-heating demand. |
7. Tune indoor conditions by occupied response | Use operative temperature and PMV to refine warm-up timing and zone control, focusing on the cool morning tail instead of raising the building-wide heating setpoint. | Improve occupied thermal comfort while avoiding unnecessary all-day heating energy. |
8. Protect cooling performance through commissioning | Commission chilled-water flow, water temperatures, valve authority and coil control against the 221.73 kW annual peak. | Maintain cooling resilience within the existing 232.63 kW plant capacity. |
This sequence preserves the low-carbon plant concept and targets the largest energy and comfort drivers first. It also avoids solving transient control problems with permanent increases in plant size or continuous maximum ventilation.
15. Conclusion
Oakfield School demonstrates a coherent low-energy building-performance strategy in which passive environmental design, daylight-responsive lighting, demand-controlled ventilation and electrified heating and cooling are assessed together rather than as separate systems.
The annual results show that the school is primarily a winter heating and ventilation problem, not a cooling problem. Heating-coil delivery reaches approximately 423.34 MWh/yr, while cooling-coil delivery is approximately 22.47 MWh/yr. The 17 February morning event produces the principal thermal and electrical peak, with a 451.91 kW hot-water-loop demand and 247.9 kW building electrical demand. The most efficient response is coordinated optimum start, staged preheat, responsive setback and controlled backup heating so that the building reaches occupied conditions gradually rather than through a short simultaneous recovery surge.
Indoor thermal conditions should be improved through better timing rather than higher global setpoints. The occupied mean PMV of approximately -0.21 and lower-temperature tail indicate that the key comfort intervention is earlier zone recovery for teaching spaces. This can improve morning operative temperature without increasing heating throughout the occupied day.
Ventilation should follow the same principle. Minimum outdoor air must be established before occupancy, particularly in high-density classrooms, and demand control should then reduce airflow as occupancy falls. This directly addresses the Classroom 11 CO₂ event while protecting fan and heating energy.
The passive and low-carbon design pathway is therefore clear: first reduce solar and lighting gains through external shading, glazing control and daylight-responsive dimming; then use the atrium, solar chimney and wind-tower concept to support controlled passive heat removal when conditions allow; next optimise heat recovery, fan pressure and demand-controlled ventilation; and finally tune heat-pump start-up, setback and zone control to remove the winter morning comfort and demand peak. Cooling plant capacity can be retained, with focused commissioning because the annual peak already reaches approximately 95.3% of nominal capacity.
Final design priority Reduce loads passively, align heating and ventilation with occupancy, minimise fan and lighting energy, and tune occupied thermal conditions by zone. This is the shortest route to lower operational energy and carbon, better morning comfort and stronger indoor air quality while retaining the existing low-carbon plant strategy. |